Monitors
An automated way to keep track of your services' status.
What are monitors?
Monitors are an automated way to keep track of your services' status, uptime and performance. They keep track of every single ping made to your service and track status codes, latency, headers, responses and more.
Miru also provides you with percentile calculations based on pings, so you can see how your service is performing over time.
Creating a monitor
In order to create a monitor, you need to have the admin role or higher in your workspace.
Head over to the admin panel and navigate to the Monitors section using the tabs on the navigation bar, from there you can click Create Monitor to start the process of setting up your monitor.
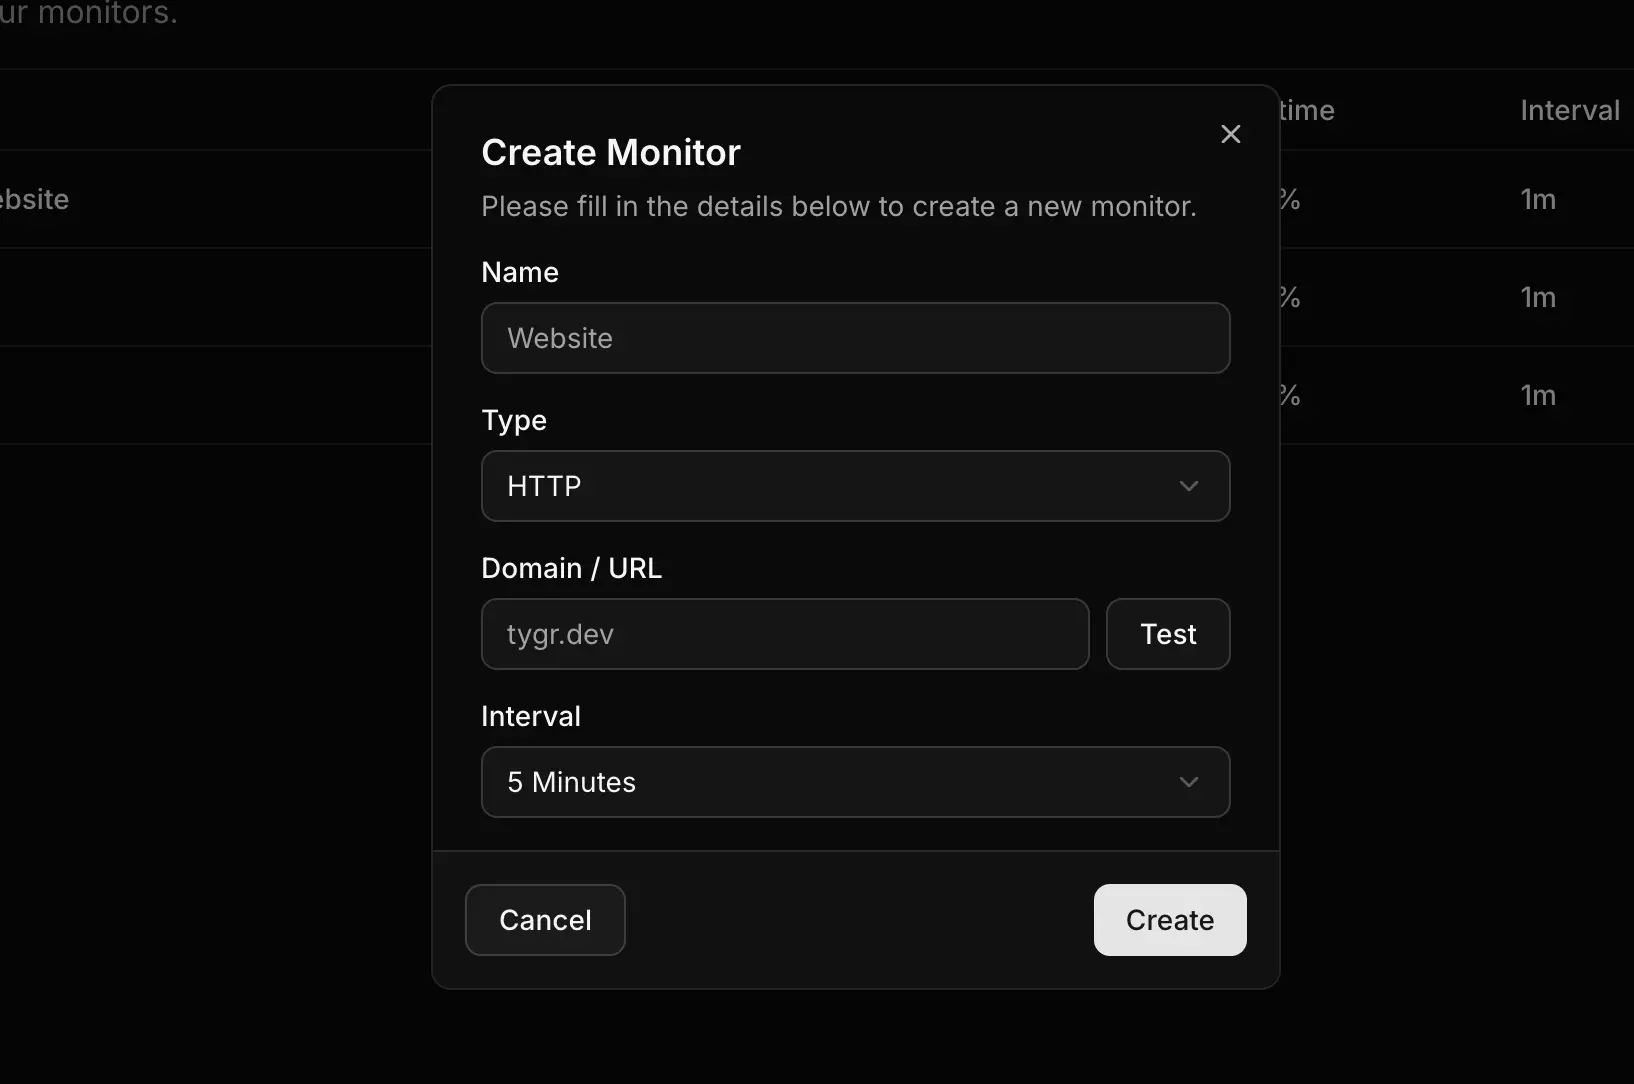
Name
The name of your monitor is entirely up to you, but keep in mind that it will be displayed on any status pages that you link to this monitor.
We recommend using a name that describes the service you're monitoring, for example API, Website, Database, etc.
Type
Monitors support the HTTP and TCP protocols, but we plan to add more in the future.
HTTP monitors build a full request (method, headers, query parameters, authentication and a body) and then check the response against criteria you define.
TCP monitors open a connection to a host and port. Connecting is the whole check.
URL
For HTTP monitors this is the exact URL to request. If you leave the scheme off, https:// is added when you save.
For TCP monitors this is a host and port, for example gateway.campsite.chat:443.
Interval
The interval is the time between each check made to your service. We recommend using the default value of 5 Minutes as this gives you a good balance between frequent checks but not too frequent that it can trigger any sort of rate limiting.
Timeout
How long to wait for a response before giving up, in milliseconds. Defaults to 30000 (30 seconds).
Building the request
A new HTTP monitor starts as a GET that has to come back 200 OK, so a plain website needs nothing more than a name and a URL. Everything below is optional.
- Method:
GET,POST,PUT,PATCH,DELETE,HEADorOPTIONS. - Query parameters: appended to whatever the URL already carries.
- Headers: sent with the request.
- Authentication:
Basic,Beareror an API key, in either a header or the query string. Applied on top of your headers, so it wins over a hand-writtenAuthorizationheader. - Body:
JSON,FormorPlain text. A matchingContent-Typeis sent automatically unless you set one yourself. - Follow redirects: on by default. Turn it off when the redirect itself is what you want to check.
Secrets
Any header or query parameter can be marked secret with the key icon next to it. Secret values are stored but never sent back to your browser or returned by the API. The field shows •••• (unchanged) instead. Leave it alone to keep the stored value, or type to replace it. Authentication credentials are always treated this way.
Success criteria
Success criteria decide whether a check passed. Each one reads part of the response and compares it against a value:
| Source | What it reads |
|---|---|
Status code | The HTTP status code. |
Response time | How long the request took, in milliseconds. |
Body | The raw response body. |
Header | A named response header. |
JSON body | A value inside a JSON response, addressed with dot notation. |
The comparisons available depend on the source. Numbers support equals, doesn't equal, is greater than, is greater than or equals, is less than and is less than or equals. Text also supports contains, doesn't contain, matches regex and is empty. A JSON body value additionally supports exists and doesn't exist.
For JSON body, the path uses dots and array indices, for example data.status or items.0.id. Numbers and booleans are compared by value, so 5 matches 5 and true matches true.
A comparison that can't be made, like asking whether a name is greater than 3, fails and tells you why rather than quietly passing.
Combining conditions
Each block of conditions has a dropdown deciding how they combine:
- All conditions are met: every condition in the block has to pass.
- Any condition is met: one is enough.
Add alternative starts a second block. The monitor is up when any one block passes, which is how you accept more than one healthy shape, for example a normal 200 or a deliberate maintenance response:
Monitor is successful if     All conditions are met
    Status code equals 200
    JSON body .ok equals true

or if                        All conditions are met
    Status code equals 503
    Body contains "maintenance"
Every monitor needs at least one condition.
Testing before you save
Send request runs the monitor once without recording anything or opening an incident. You get the response back along with every criterion and whether it passed, including what the response actually contained. A failure reads JSON body .ok equals true ✗ (got false) rather than just failing.
Viewing your monitor
Once you've created your monitor, Miru will automatically start checking your service and tracking the status codes, latency, headers and responses. The Monitoring Service concept covers where those checks actually run.
Actions
You can perform various actions on your monitor by clicking the three dots on the right of the monitor name in the list of monitors. You can find the following actions:
- Edit: Edit the monitor settings.
- Details: View the monitor details.
- Test: Run the monitor's checks now (This won't store the ping in the logs).
- Ping: Manually ping your monitor (This will store the ping in the logs).
- Copy ID: Copy the ID of the monitor to your clipboard.
- Delete: Delete the monitor.
Overview
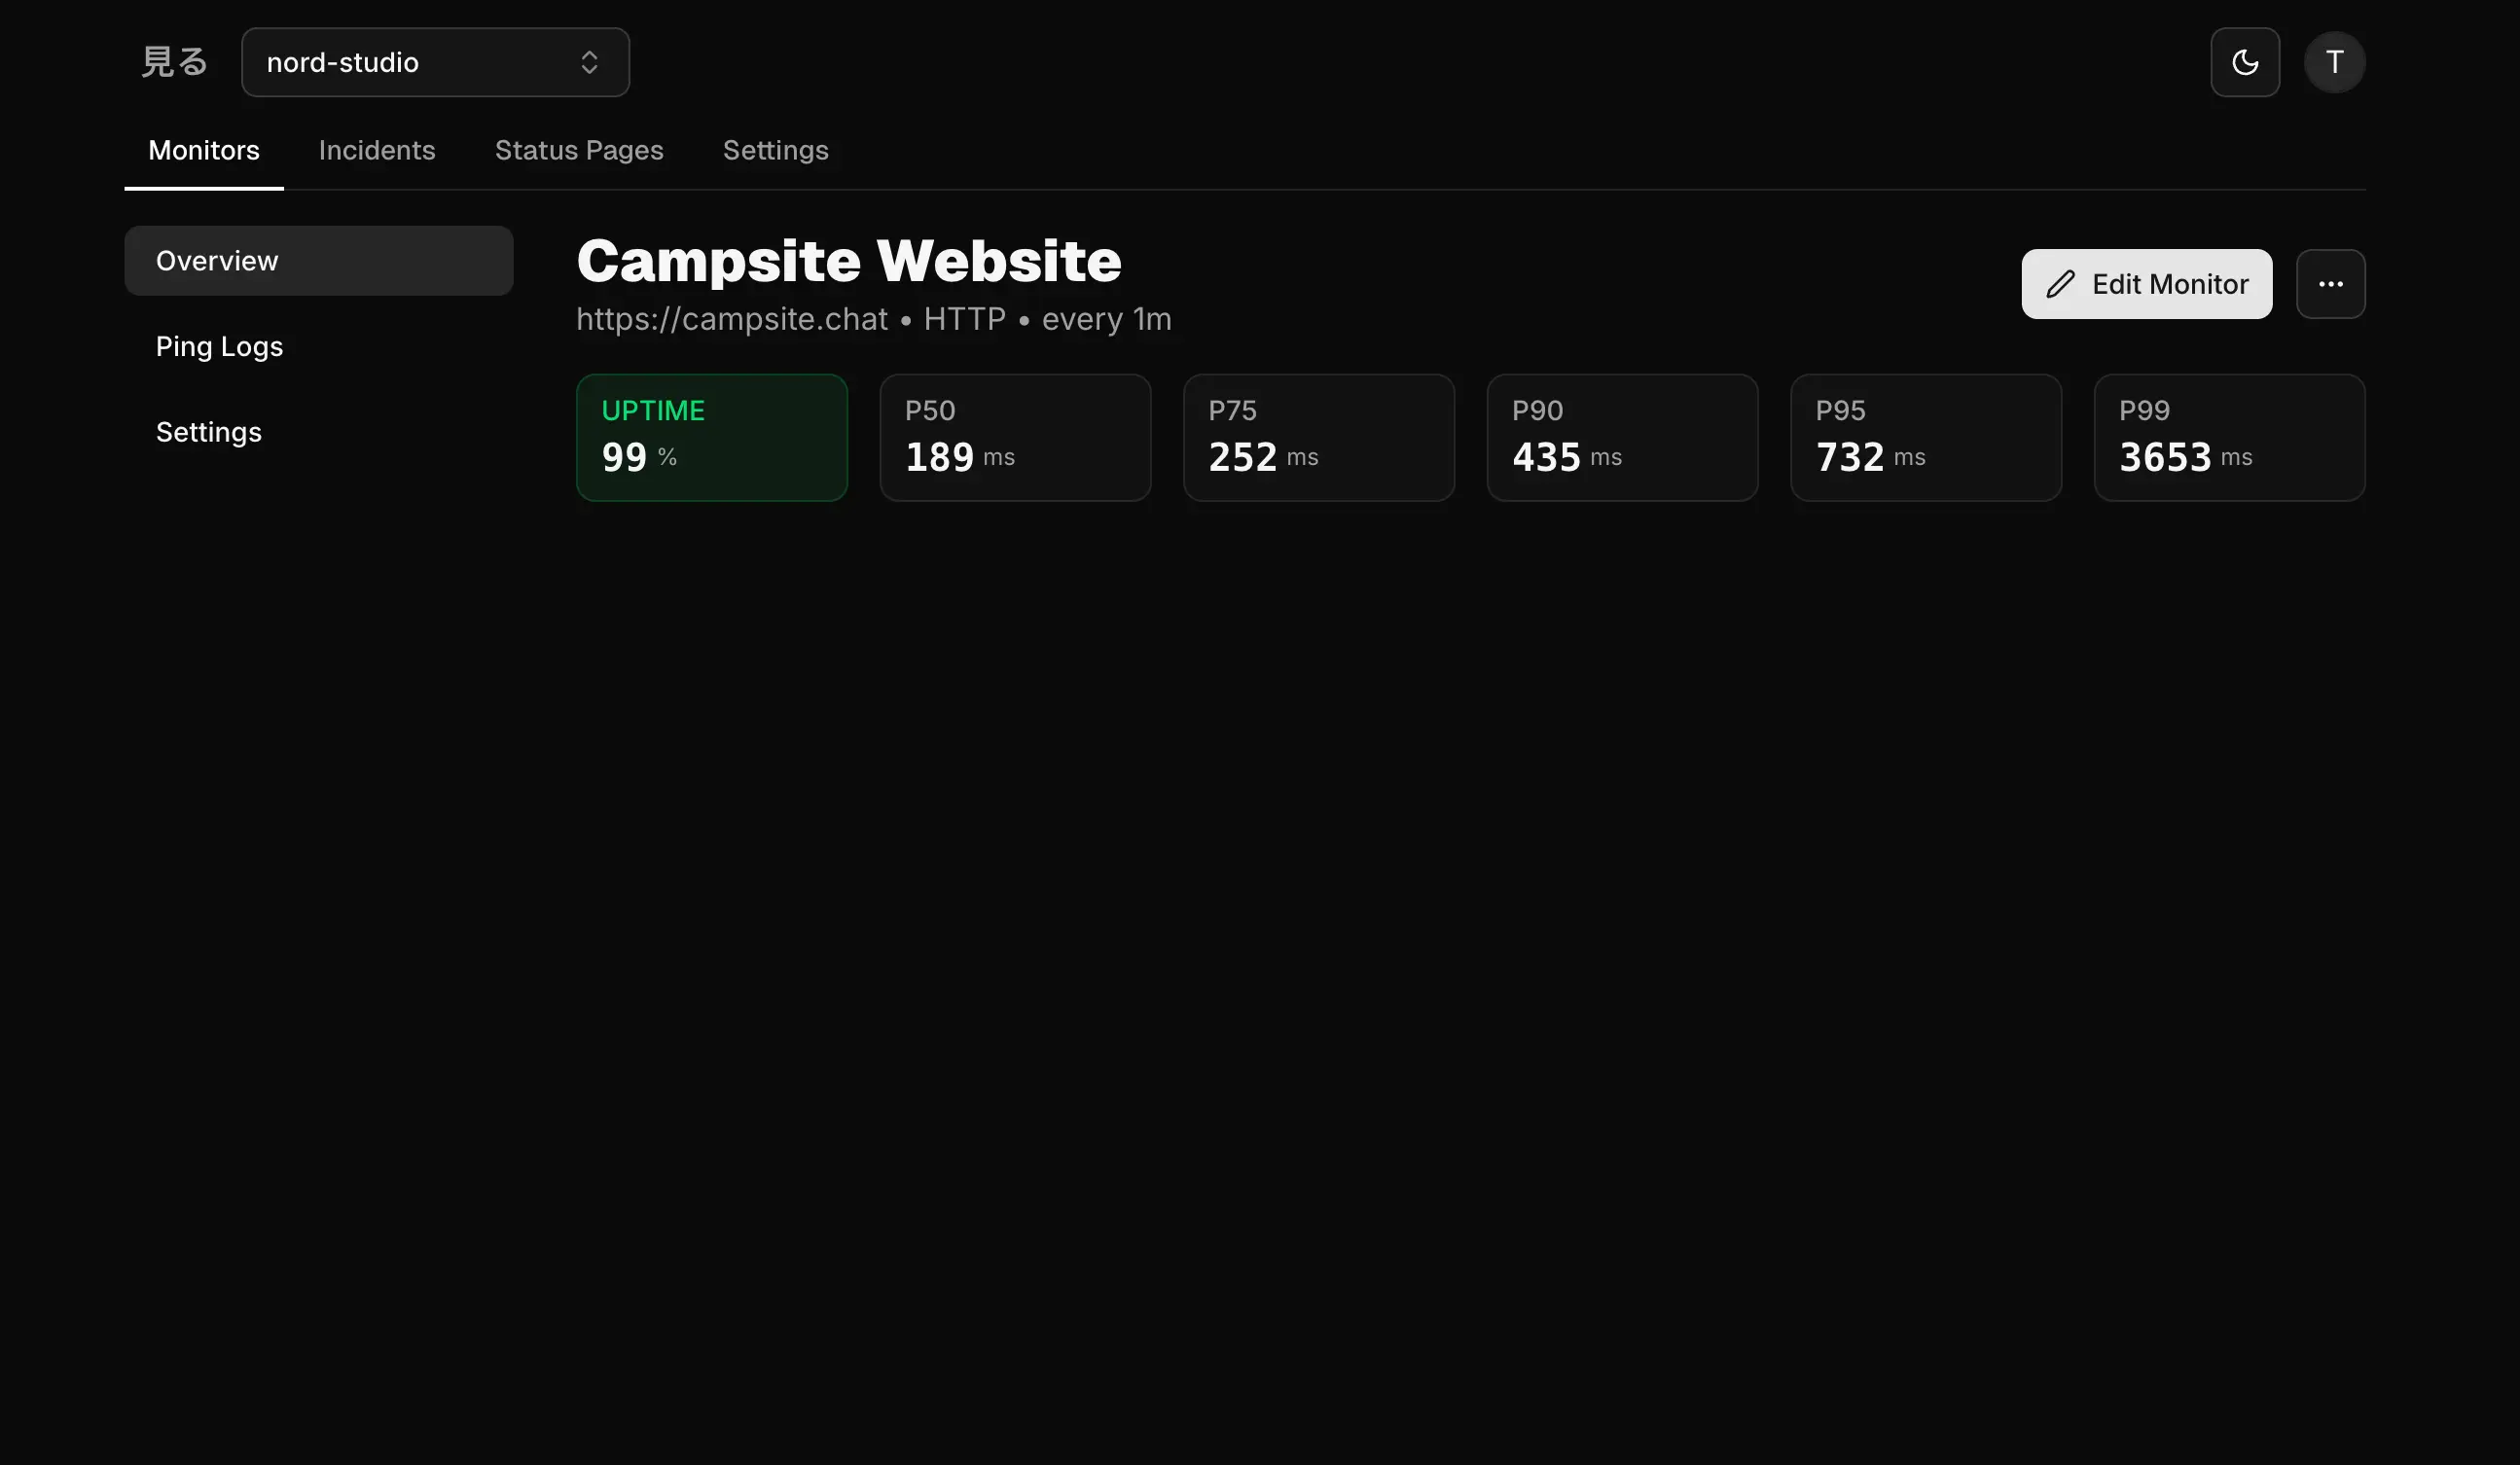
The overview screen shows you the uptime of your service and various latency percentiles based on the pings made to your service. We plan on adding more graphs and other data in the future, but for now this is all we have.
Ping Logs
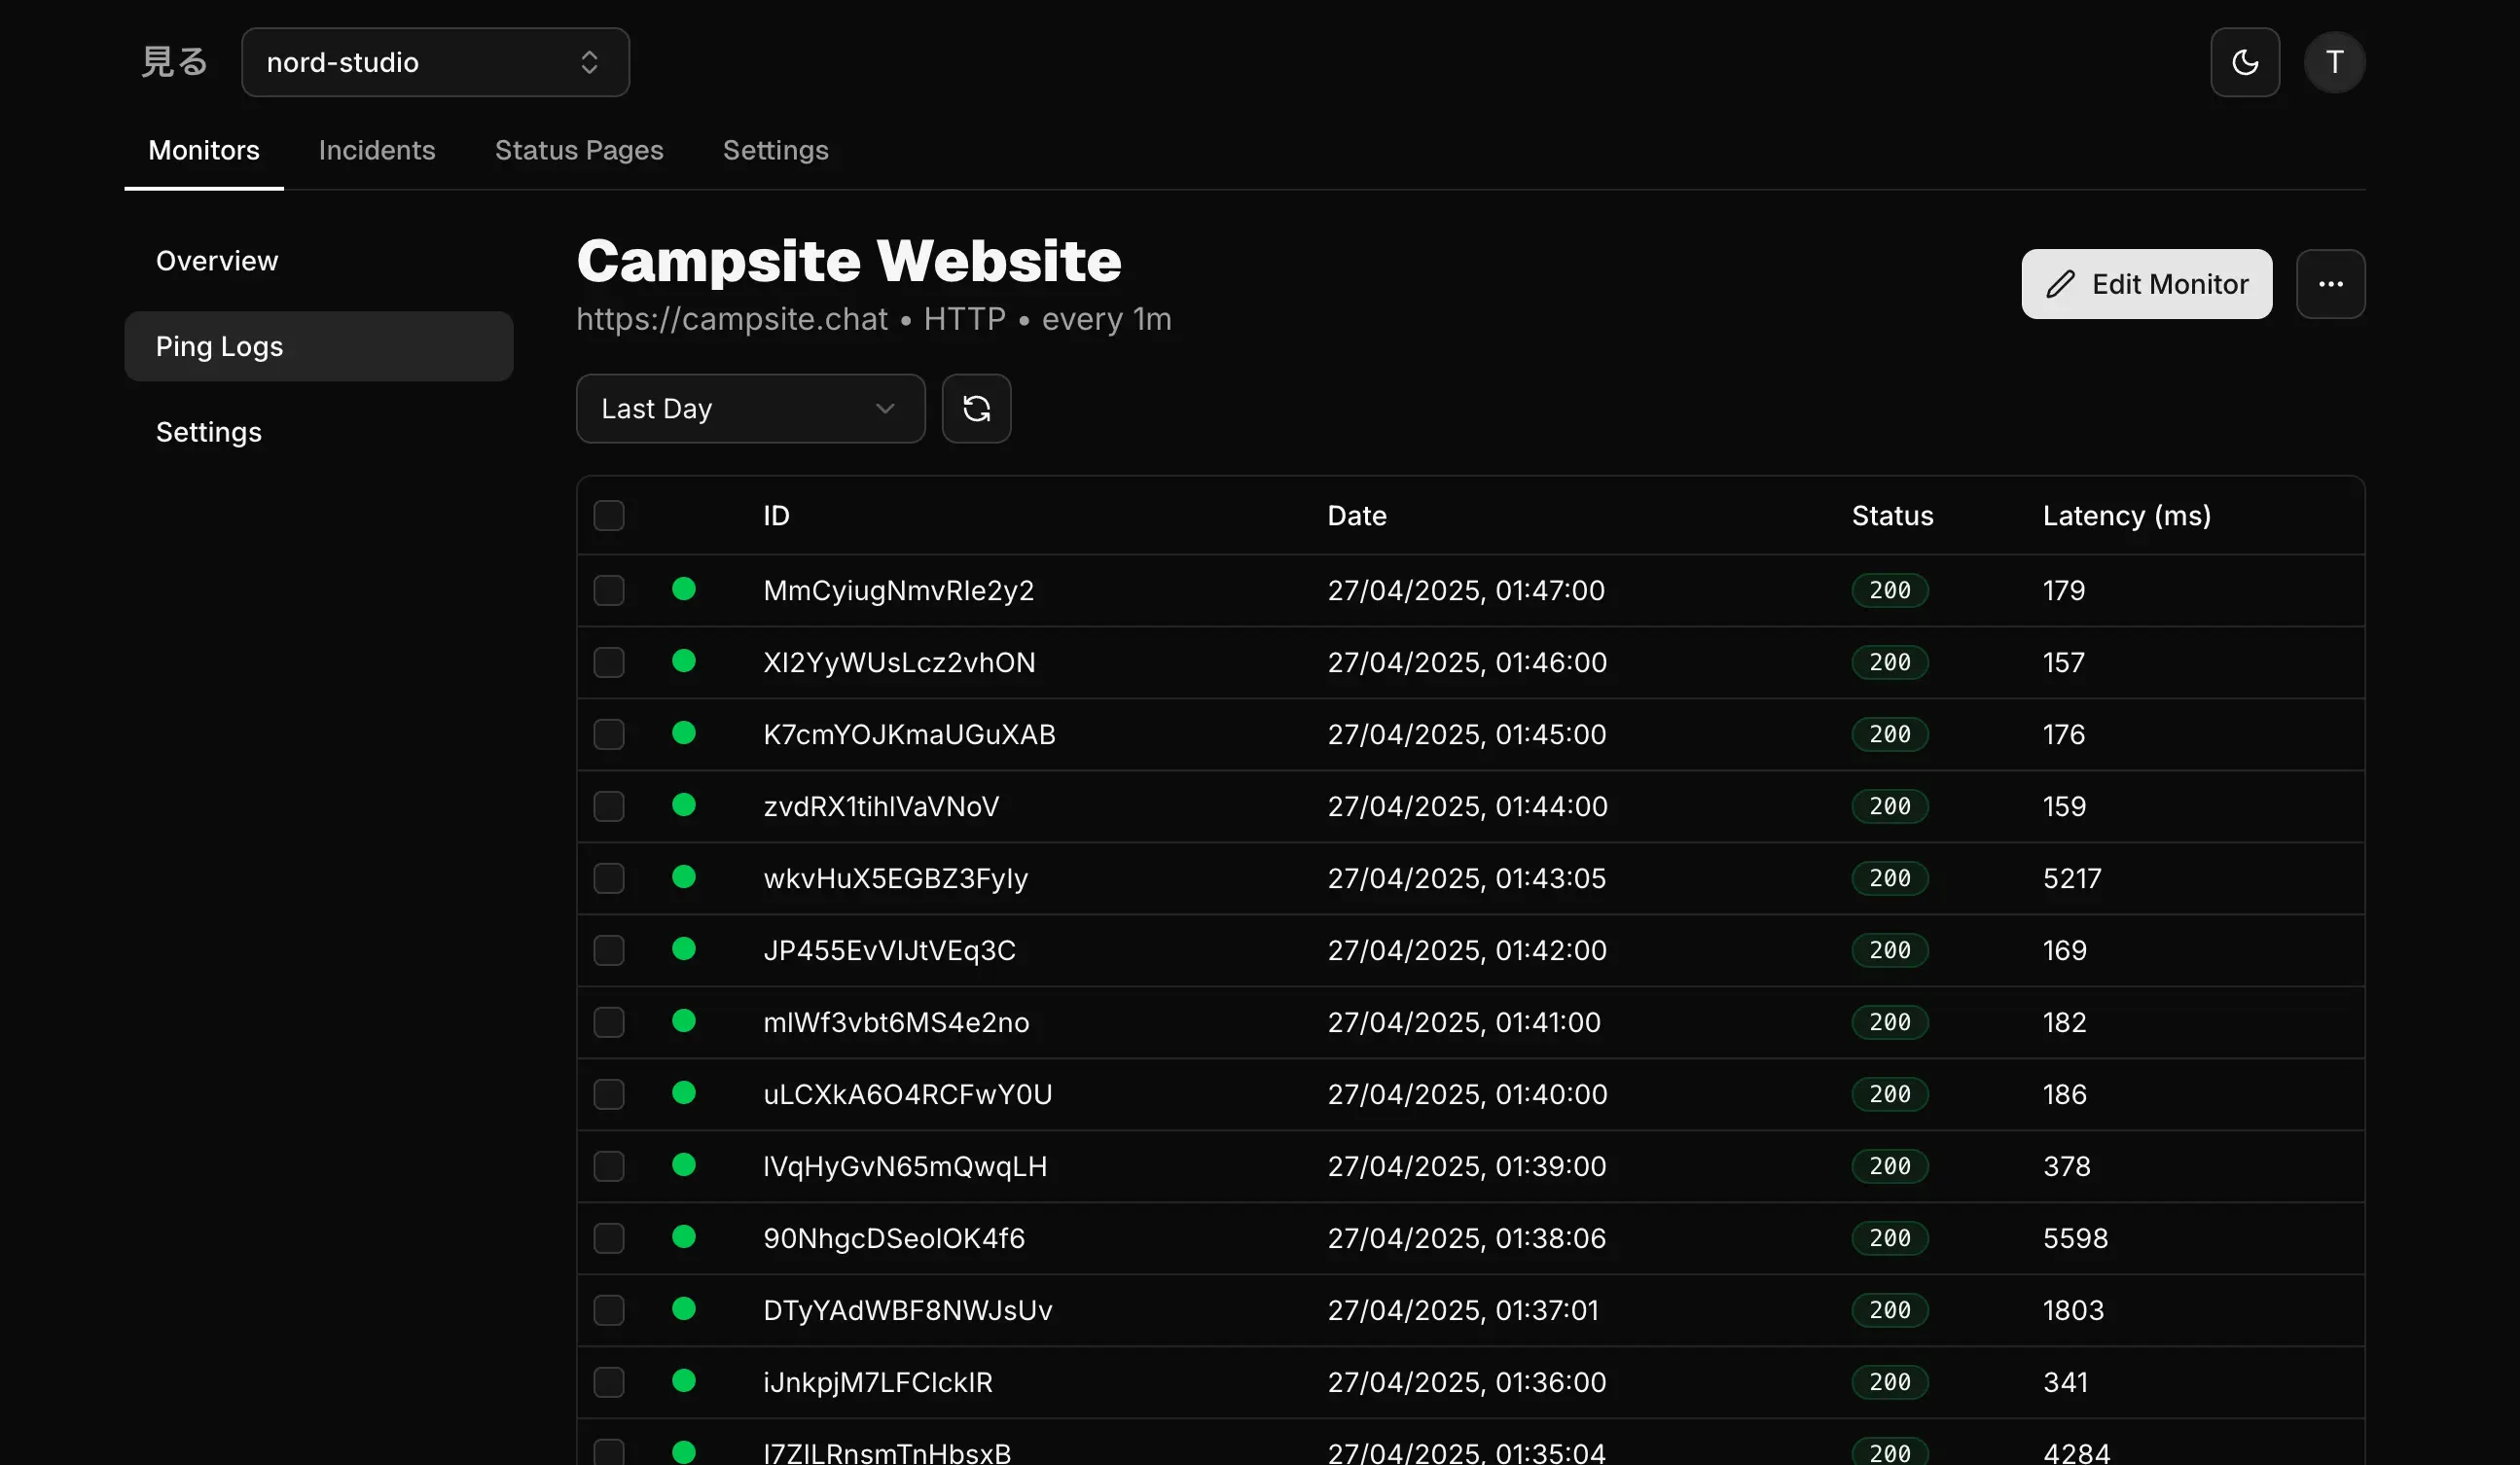
The ping logs screen contains a table with all the pings ever made to your service. You can filter the table by the last day, week, 2 weeks, etc. You can also display more or less pings on each page, and navigate between pages at the bottom of the table.
Clicking on a ping will show you the details of the ping, including the response headers and the response body. For HTTP monitors it also records which criteria passed and which didn't, so you can see why a check failed after the fact.
Settings
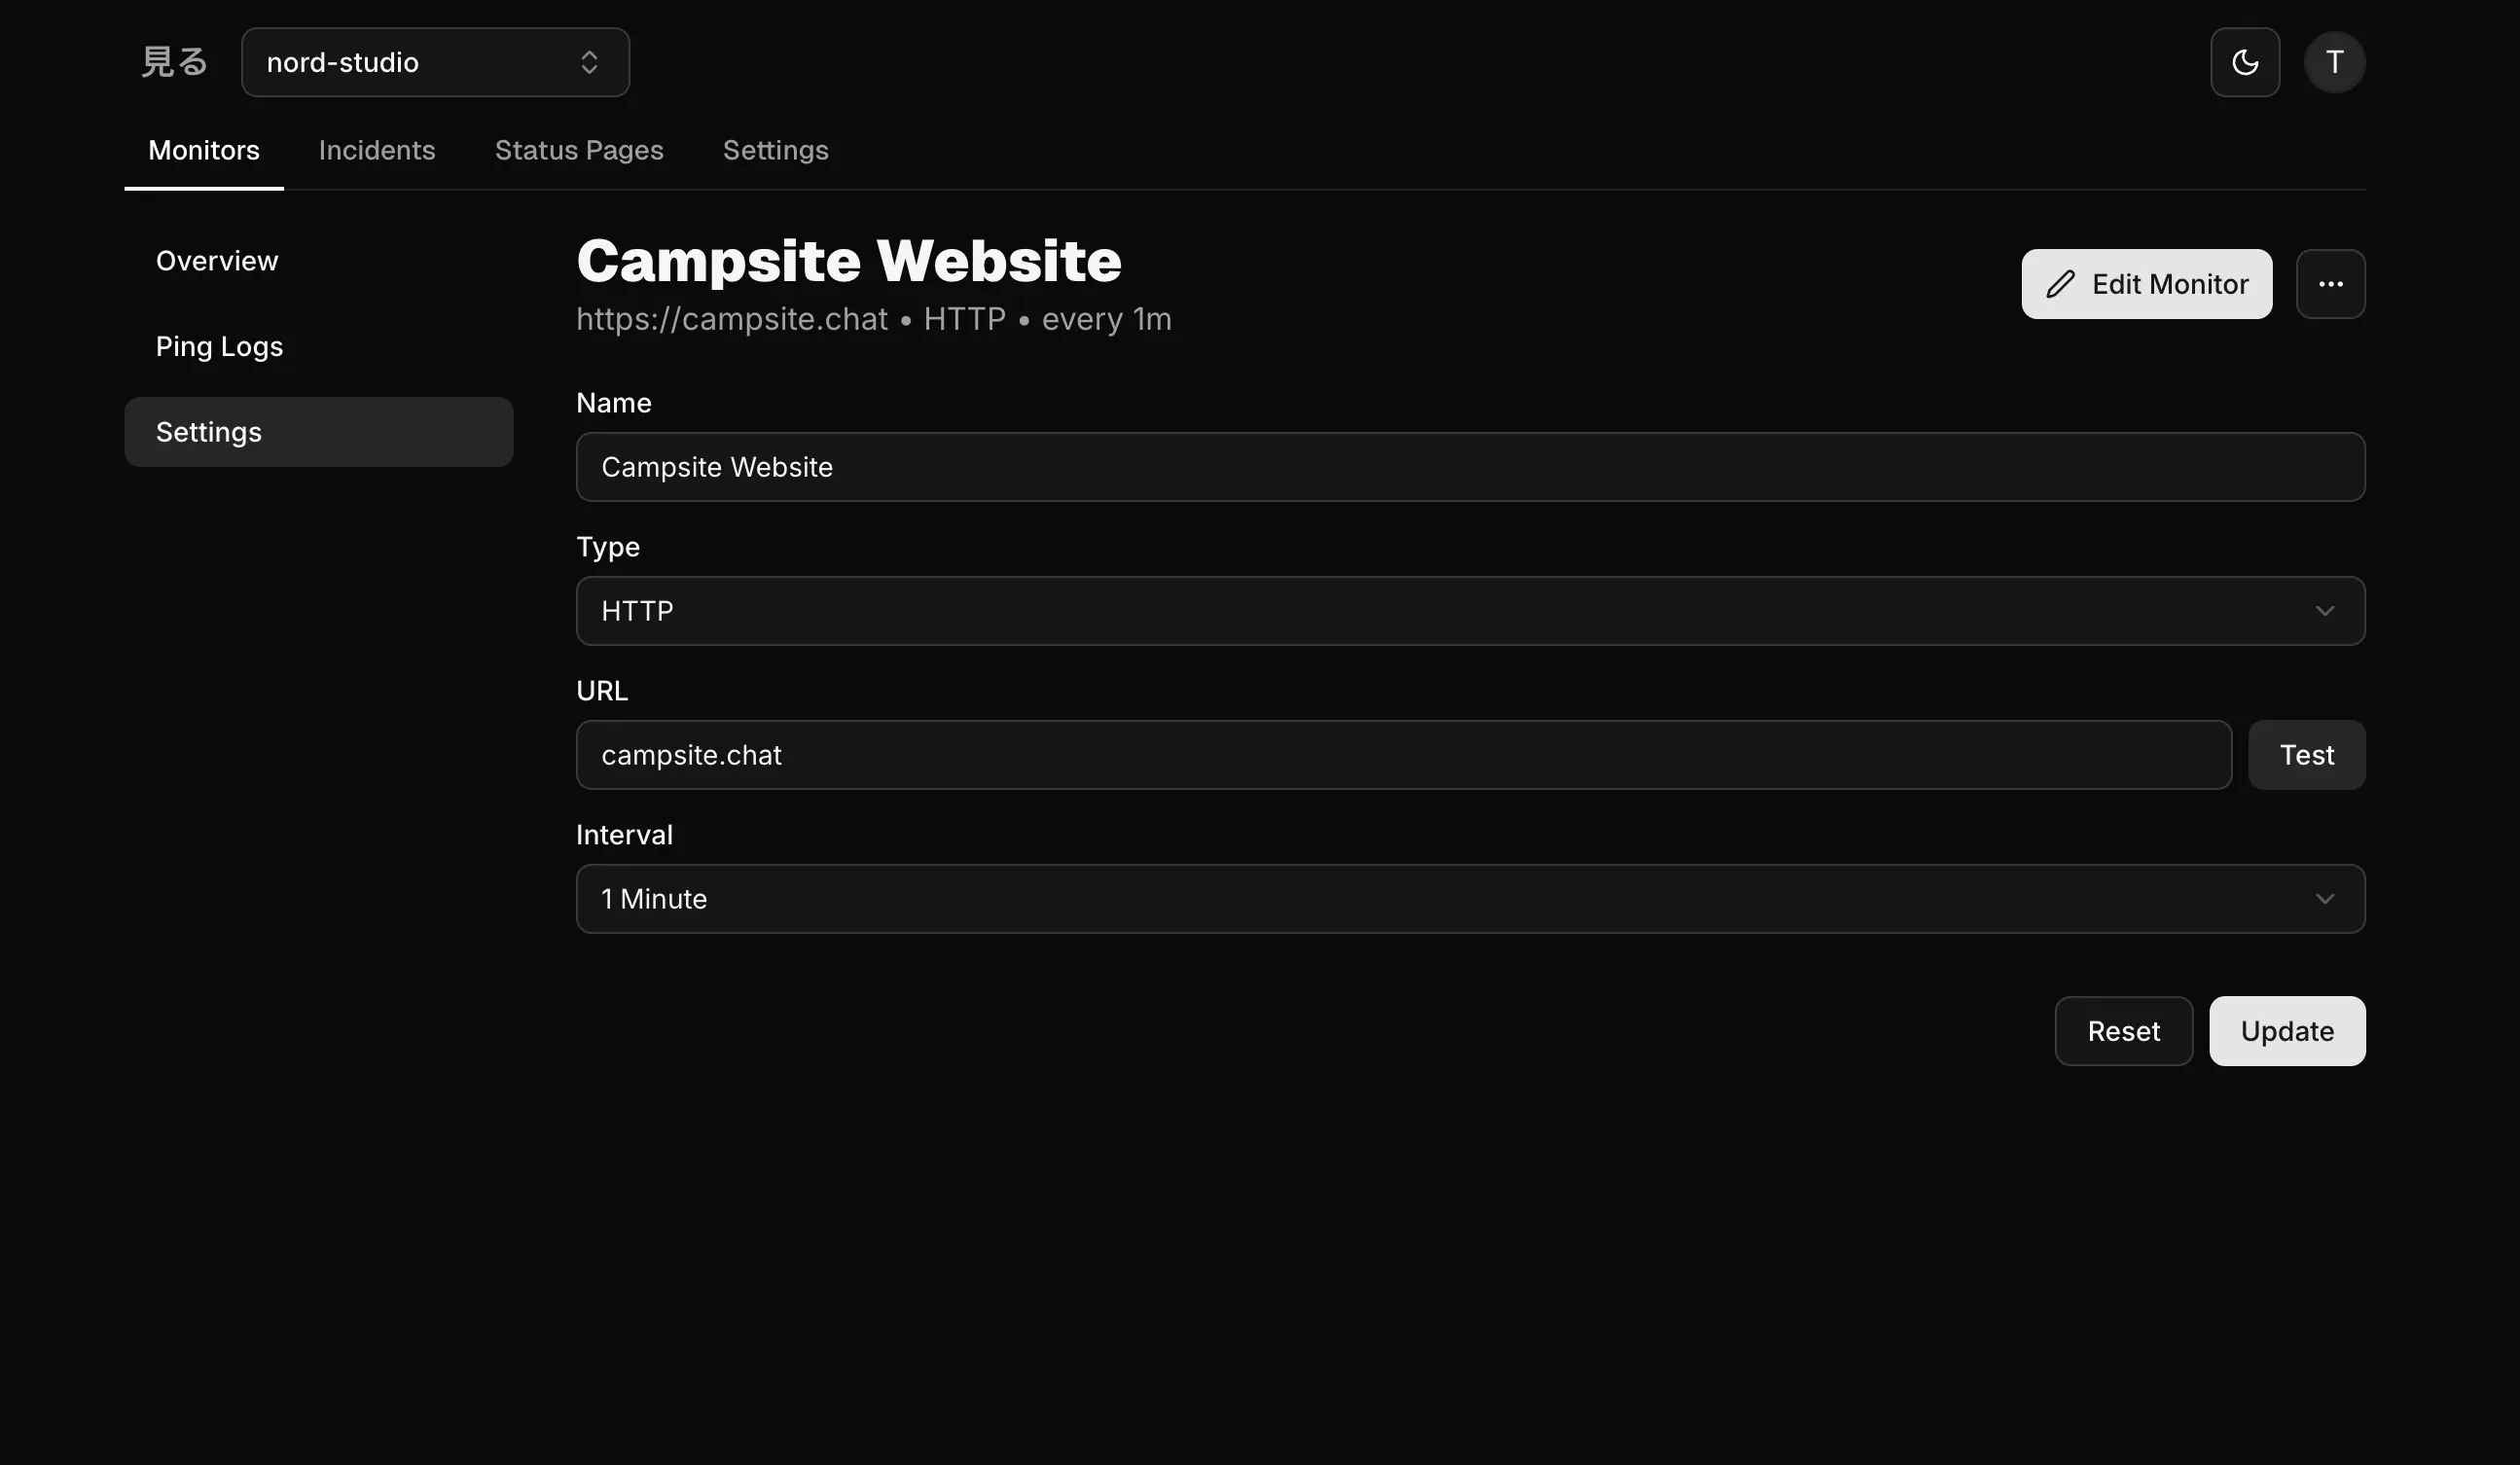
At any point, you can edit your monitor either by clicking the Edit button in the many dropdown menus, or by clicking the Settings tab on the monitor details page. This is the same screen you used to create it, so the request, the success criteria and the test button are all editable here.
Bear in mind that all your previous data will remain after any change which can lead to confusion. We reccomend creating a new monitor instead of editing an existing one if you want to change the type or domain of your monitor.
What's next?
Once you've created your monitor, you can link it to a status page to display the status of your service to your users. Check out the Status Pages concept to learn more.